
Management discussion and analysis
FINANCIAL REVIEW
MUR 1.6bn
2018: MUR 766.4m
30%
2018: 32%
21%
2018: 25%
MUR 139.9bn
2018: MUR 120.4bn
MUR 132.2bn
2018: MUR 113.5bn
MUR 7.7bn
2018: MUR 6.9bn
15.85%
2018: 14.71%
BUSINESS SEGMENTS ACHIEVEMENTS
CONSUMER BANKING
In FY19, the Consumer Banking Cluster had a productive year with a much-improved results as compared to FY18. Our liabilities book increased by 16% (5% in Current and Savings accounts and 33% in Fixed Deposits) while our assets book increased by 35%.
This performance is primarily due to the shift in focus for FY19. Our strategy was focused around rebuilding our brand image through increased proximity with the High Net Worth Individuals (HNWI) community.
With this as our objective, we organised some lifestyle events, like customer cocktails, golf games, among many more. The AfrAsia Mauritius Golf Open 2018 was an opportunity for our high-end clients to interact with high profile world professional golfers such as Romain Langasque, Mathieu Pavon and Marcel Siem during private events get-together.
Internally, we had more cross-selling opportunities across the Bank. We also worked on the turnaround time for loan applications, which reduced considerably in the last FY giving ABL a competitive edge in the market while still maintaining the rigorous KYC process. Moreover, a more rigorous approach for the daily management of arrears and excesses by Relationship Managers (RMs) were implemented, resulting in a significant drop in downgrading of accounts to Non-Performing Assets (NPA). Furthermore, the Bank revitalized and launched its credit card loyalty programme “XtraMiles”.
During FY19, our sales team was reorganised in order to better serve our clients. Hence, a new mentoring and RM pairing programme was introduced whereby junior staff started being mentored by the senior RMs. Consequently, significant improvement has been recognised in our customer service delivery.
Our focus to upskill our team members probably is the main reason for the very good results that Consumer Banking reaped in its employee engagement score in Staff Engagement Survey 2018. With a score of 71%, Consumer Banking was above amongst the best engagement of the Bank; this is testament to the team spirit within Consumer Banking. This was achieved through a high level staff motivation across the business. Much efforts were spent on having team bonding events, be it among ourselves and jointly with colleagues from other departments.
Furthermore, due to internal issues faced by some of our main competitors, we saw a number of their valuable clients moving their accounts to ABL due to the level of affiliation between the RMs and their clients. Our RMs were quick to respond by proposing a dedicated service and ready to offer tailor-made solutions to prospective customers.
On a final note, ABL is actively attracting Wealth Management Business from the region, mainly by local RMs visiting and targeting clients in Madagascar with our South African Representative Office (SAREPO) exploiting the Sub-Sahara Africa region.
ECONOMIC OUTLOOK
THE GLOBAL ECONOMY
From BMI Research - The outlook for the global economy has deteriorated since mid-May, when trade tensions between the US and China re-escalated following the collapse in trade talks. These tensions are running centre-stage at a time when global growth momentum has been weakening and financial conditions tightening as measured by several indices. These dynamics point to continue downside risks to our global forecast of 2.9% growth for 2019, which already marks a downward revision from 3.0% last month, and we see the potential for even slower growth in the event that trade tensions escalate further. Over the past month, we have revised our forecast for several countries including the Australia, Brazil, Canada, Egypt, Mexico, Thailand and US, and we have also revised our outlook for oil prices slightly lower. Data coming out of the US have weakened slightly in recent months across several sectors of the economy, ranging from the labour market, trade, production and inventories, to business conditions, profit margins as well as financial conditions.
The slowdown in high frequency indicators combined with rising trade risks has resulted in a sharp re-pricing of market expectations for the US Federal Reserve (Fed), indicating expectations for around 75 basis points (bps) of cuts in 2019 and another 25bps in 2020, BMI Research June 2019.
EMERGING MARKETS
A sharp rise in expectations of interest rate cuts by the Fed in 2019 following the collapse in US-China trade talks in May has provided some respite to Emerging Markets (EMs) since the start of June as capital outflows have partially reversed. This has also allowed a number of central banks to adopt a more dovish policy stance in a bid to offset slowing growth.
For example, in contrast to substantial tightening through much of 2018, central banks in Turkey, South Africa and Indonesia (to list a few) have kept their benchmark rates on hold through this year (although the latter two have recently hinted at looser policy in the coming months), while central bank policymakers in Egypt, India, Malaysia and the Philippines have cut their respective benchmark policy rates in the year to date. Although Turkey has held its policy rate, it is using less overt and more unorthodox measures to tighten while waiting for a window of opportunity to cut should inflationary pressures subside. Given ongoing trade risks and the potential for risk appetite to shift, aggressive monetary loosening could leave some EMs exposed to a sudden return of capital flight, similar to what was seen in 2018. Significant uncertainty remains as to whether the China and US will strike a deal to alleviate trade tensions, or whether Trump will follow through on his pledge to raise tariffs on the remaining USD 300bn worth of imports from China. Even if the two sides do strike a deal, it will likely be a superficial agreement, in our view, with prolonged uncertainty continuing to weigh on investor sentiment in the coming months, BMI Research June 2019.
RISK FACTORS
Risk sentiment has deteriorated substantially in recent weeks, posing downside risks to our forecast for the global economy to grow by 3.0% in 2019, which is unchanged from last month’s forecast. While strong services sector growth in recent months has been offsetting some of the weakness in the manufacturing sector across many countries, momentum is now starting to slow in the services sector. Moreover, the softness in manufacturing activity and trade could be more prolonged than we originally thought given the recent rise in trade tensions between China and the US, which saw the US administration raise tariffs on USD 200bn of Chinese imports to 25.0%, from 10.0% previously, and threatened to impose tariffs on the remaining USD 300bn. China retaliated by announcing additional tariffs of between 5.0% and 25.0% on USD 60bn worth of its imports of US goods – set to take effect from 1 June.
Risk assets such as emerging market FX and equities responded negatively to the latest trade developments, while safe-haven assets such as US Treasuries were bid up. At this point, we believe that US-China trade risks are likely mostly priced in, even though it is still too early to fully estimate the medium-to-long term consequences. Moreover, despite the increase in tariffs, both sides will continue negotiating in the hope of finding some common ground. That said, the combination of rising tariffs, the potential for higher imported inflation and general risk aversion could start to feed through to investment and consumption decisions which could see growth slow over the coming quarters.
KEY TO WATCH
Brexit Remains a Major Downside Risk
In case of a disorderly Brexit-induced economic slowdown (not our core scenario), the Bank of England might face a dilemma (see ‘Downside Risk Scenario: The Impact of a No-Deal Brexit on the UK Economy’, February 25). It would have to choose between raising interest rates to defend the pound and stave off inflation risks on the one hand, and loosening monetary policy to support the economy on the other. Should it opt for hiking rates, the government would face rising financing costs in line with increases in bond yields. Higher debt servicing costs would reverse the hitherto downward trend of the debt-to-GDP ratio seen in recent years. That said, the debt maturity profile would remain favourable even in a disorderly Brexit scenario.
The average maturity of public debt has been consistently longer than the average across the G7 group of advanced economies, and currently stands at 15.0 years, nearly twice as much as France and Japan (approximately 7.8 years) and well above Germany, Italy and the US (6.4 years on average). This implies that the UK will face a manageable debt refinancing burden in the coming years, even if economic conditions deteriorate, BMI Research UK Country Risk Q3 2019.
The US Currency and Its Monetary Policy
Most importantly will be movements in the US dollar as well as US monetary policy. The recent sell-off in risk assets did not coincide with a substantial strengthening of the greenback as one would expect, as much of the weakness in the dollar index seems to have been driven by the euro and sterling.
While we maintain our neutral view of the US dollar, we continue to highlight upside risks, which would be negative for risk assets in general. At the same time, US interest rate futures are pricing in about 25bps worth of cuts by the US Federal Reserve (Fed) by the end of the year. If correct, this could signal a Fed that is worried about growth, which is in contrast to previous statements that described the US economy as strong, and is in distinction to our own view where we still see scope for one hike by end 2020, although risks to the view are clearly to the downside, BMI Research May 2019.
THE MAURITIAN ECONOMY
Although Mauritius lacks natural resources, it is one of the leading African economies. It is ranked 1st as a long-term political and economic country among the Sub-Saharan countries (Fitch Solution, pg. 39-40). Its political stability and unique position in the Indian Ocean has enable Mauritius to place itself as a gateway for investment into the African continent.
Even though the past year has been filled with global economic uncertainties and various geopolitical events, Mauritius was able to maintain a steady average GDP growth of 3.8% (refer to Table 1) and is expected to reach 3.9% this year. In fact, in his Budget speech in June 2019, the Prime Minister confirmed that Mauritius’ GDP has passed the half trillion rupee mark this year (Budget Speech, pg. 5). In general, “a relatively stable growth outlook, prudent monetary policy and low but growing consumer and business confidence is slightly tempered by modest demand for exports from key trading partners such as the UK and France on the back of growth prospects for these areas” (Fitch Solutions, pg. 6).
The main contributing factor to the Mauritian GDP is household consumption, representing approximately 77.0% of the GDP (Fitch Solutions, pg.12). This explains the several Government’s social measures to boost purchasing power, for example increasing pension etc. (PwC, pg.5). The financial and construction sectors are also big contributors to the economic growth. The direct investments of big construction developments happening in Mauritius are contributing to the economic growth.
THE DIFFERENT SECTORS
Sugar Sector Weakening Agriculture and Manufacturing.
Construction Supporting Growth
Gross Value Added By Sector, % change y-o-y (2016-2018)
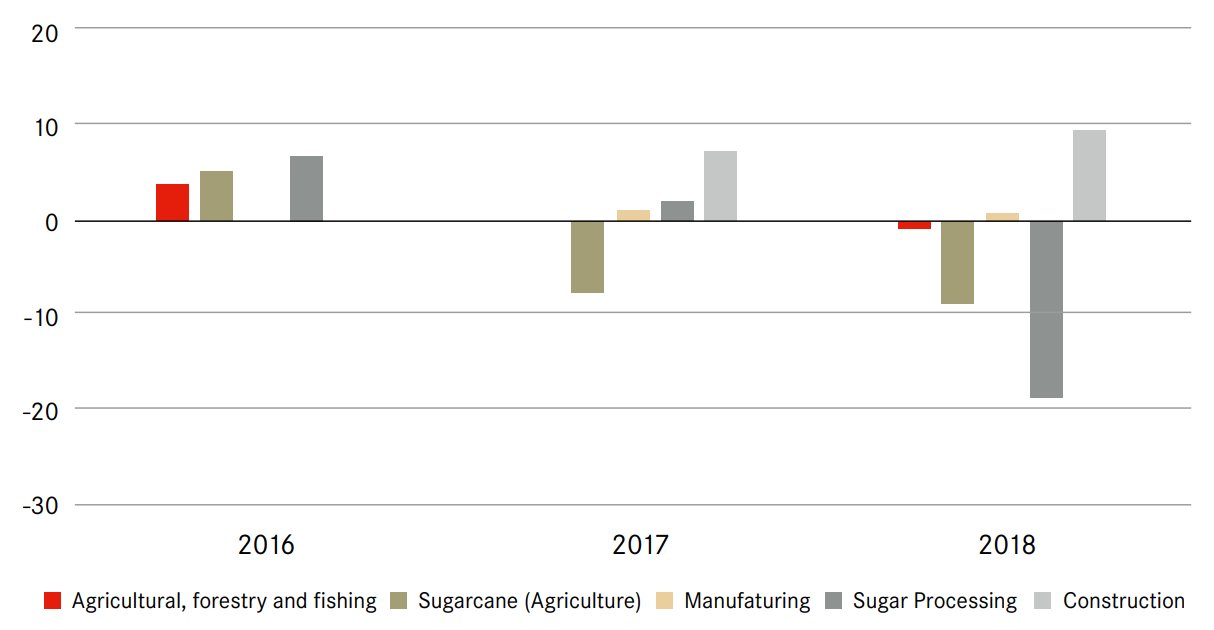
Agriculture and Sugar Industry
“The sugar sector – including both sugarcane growing and processing – made up 2.9% of gross value added (GVA) in 2018 and is a major export earner for Mauritius. The sector has faced major weakness in recent quarters due to the end of sugar production quotas in Europe – the largest market for Mauritian sugar – and weak global sugar prices” (FS, pg. 9). In the budget 2019-2020, the Prime Minister tried to boost the agriculture and tea sector by providing incentives to the planters, such as doubling the winter months’ allowance that tea growers receive.
The tourism industry
The tourism industry is one of the main industries of the Mauritian economy. The total arrival of tourists increased by 4.6% between 2017 and 2018.
Tourist arrivals from main markets for year 2017 and 2018

The construction industry
With the big projects, such as “the construction of a light rail network, government buildings and new homes”, the construction industry was the industry that expanded the most in the last two years and is expected to continue being a key sector for economic growth in future years.
Financial sector
“The financial services sector's growth is being aided by Mauritius' favourable tax status, with substantial funds directed through the country before being reinvested in markets such as India and other SSA countries. Although the sector is coming under threat from negotiations over tax agreements with many of these countries – India most crucially – we expect it to continue to grow over the long term nonetheless, and to increase at around the 5.0% mark at which it has been expanding in recent years. This will be powered by both increasing domestic demand for banking services, and an increase in provision of financial services to foreign markets”.
-
THE PERCEIVED RISK FACTORS
Due to the Double Taxation Agreement (DTA) between Mauritius and India, the Mauritius International Financial Centre has facilitated a lot of investment flows into India, making Mauritius the biggest provider of foreign direct investment to India (The Economic Times). However, since April 2019, the DTA has been amended to be par with other DTAs signed by India. Hence, it is speculated that many investors who were routing money through Mauritius to invest in India would not necessarily choose Mauritius anymore. This could potentially impact the Mauritian financial sector negatively. However, cross-border investments are not limited on the taxation cost but international investors are also concerned with the investment, operational and legal risks. Since Mauritius is an IFC, it has all the components to help the international investors to minimize these risks.
Moreover, the uncertainty of the Brexit deal will impact Mauritius as there is an expected slowdown of the European economy. Mauritius is closely tie to the region, especially with France and the U.K. They are key trading partners to Mauritius and hence, the export and tourism industries are likely to suffer a weaker growth rate. Besides Brexit, “Mauritius' dispute with the UK and USA over the Chagos islands, combined with deepening ties with China, may cause some tensions in trade and diplomatic relations”. Nevertheless, due to recent trade agreements and the close economic ties between Mauritius and the U.K., it is unlikely that there will be any major trade restrictions implemented in the short-term between the two countries.
In addition, with the uncertainty looming over Brexit, the European economy is expected to have a slower growth. Hence, since France and the U.K. are the main tourism markets for the island, Mauritius will have to find new markets to sustain this industry. The government has derived new strategies, including opening Mauritius to the medical tourism and targeting new markets like the Scandinavian countries.
-
FUTURE VISION FOR MAURITIUS
The geographic location of Mauritius will play an important role for its future. The government wants to make Mauritius a transhipment hub for the Sino-African and Indo-African trade with a plan to expand the port and increase storage facilities. “This will bring new opportunities to the service sector and boost the transport service exports as well as re-exports over the long term”. Mauritius also aims to reinforce its tourism, education and banking sectors as well as, promote itself as a medical tourist destination. By offering advanced healthcare services, Mauritius will be able to attract patients from the African and Middle East region.(FS, pg.31).
2016 2017 2018e 2019f 2020f WORLD 2.6 3.1 3 2.6 2.7 Angola -2.6 -0.1 -1.7 1.0 2.9 China 6.7 6.8 6.6 6.2 6.1 Euro Area 2.0 2.4 1.8 1.2 1.4 India 8.2 7.2 7.2 7.5 7.5 Japan 0.6 1.9 0.8 0.8 0.7 Kenya 5.9 4.9 6.3 5.7 5.9 Malaysia 4.2 5.9 4.7 4.6 4.6 Mauritius 3.8 3.8 3.8 3.9 3.9 Nigeria -1.6 0.8 1.9 2.1 2.2 Philippines 6.9 6.7 6.2 6.4 6.5 South Africa 0.6 1.4 0.8 1.1 1.5 Thailand 3.4 4.0 4.1 3.5 3.6 United States 1.6 2.2 2.9 2.5 1.7 Vietnam 6.2 6.8 7.1 6.6 6.5 REAL GDP GROWTH

PERFORMANCE HIGHLIGHTS
| AFRASIA BANK LIMITED | 30 June 2017 | 30 June 2018 | 30 June 2019 |
|---|---|---|---|
| STATEMENT OF PROFIT OR LOSS AND OTHER | |||
| COMPREHENSIVE INCOME (MUR'm) | |||
| Net interest income | 1,212 | 1,710 | 2,311 |
| Non-interest income | 1,000 | 1,193 | 1,382 |
| Total operating income | 2,212 | 2,903 | 3,693 |
| Total operating expenses | 712 | 927 | 1,109 |
| Profit after tax after OCI | 805 | 766 | 1,579 |
| STATEMENT OF FINANCIAL POSITION (MUR'm) | |||
| Total assets | 100,406 | 120,400 | 139,873 |
| Loans and advances | 27,513 | 28,066 | 28,169 |
| Deposits from customers | 91,083 | 111,385 | 131,208 |
| Total equity (including Class A shares) | 5,992 | 6,899 | 7,716 |
| PERFORMANCE RATIOS (%) | |||
| Return on average equity | 19 | 14 | 25 |
| Return on average asset | 0.9 | 0.7 | 1.2 |
| Loans-to-deposits ratio | 30 | 25 | 21 |
| Cost-to-income ratio | 32 | 32 | 30 |
| CAPITAL ADEQUACY RATIO (%) | |||
| Basel III | 13.09 | 14.71 | 15.85 |
| AFRASIA BANK LIMITED AND ITS SUBSIDIARIES | 30 June 2017 | 30 June 2018 | 30 June 2019 |
|---|---|---|---|
| STATEMENT OF PROFIT OR LOSS AND OTHER | |||
| COMPREHENSIVE INCOME (MUR'm) | |||
| Net interest income | 1,206 | 1,706 | 2,311 |
| Non-interest income | 1,055 | 1,277 | 1,417 |
| Total operating income | 2,272 | 2,983 | 3,728 |
| Total operating expenses | 771 | 994 | 1,200 |
| Profit after tax after OCI | 798 | 763 | 1,627 |
| STATEMENT OF FINANCIAL POSITION (MUR'm) | |||
| Total assets | 101,399 | 121,961 | 141,361 |
| Loans and advances | 27,513 | 28,066 | 28,169 |
| Deposits from customers | 90,601 | 111,136 | 131,033 |
| Total equity (including Class A shares) | 5,932 | 6,836 | 7,701 |
| PERFORMANCE RATIOS (%) | |||
| Return on average equity | 19 | 15 | 26 |
| Return on average asset | 0.9 | 0.7 | 1.2 |
| Loans-to-deposits ratio | 30 | 25 | 21 |
| Cost-to-income ratio | 34 | 33 | 32 |
| CAPITAL ADEQUACY RATIO (%) | |||
| Basel III | 12.74 | 14.10 | 15.30 |
CURRENT YEAR PERFORMANCE AGAINST OBJECTIVES AND FUTURE GROWTH
Statement of Profit or Loss and Other Comprehensive Income – Total Operating Income
KPI
The Bank forecasts total
operating income of MUR
3.2bn for the FY19.
OUTCOME
The Bank achieved a total
operating income of MUR 3.7bn,
that is, an excess of 14% over
budget.
TARGET FOR NEXT FY
Due to challenging market
conditions, the Bank is expected
to achieve a marginal growth in
its total operating income for
FY20 at MUR 3.9bn.